A few weeks ago I had the pleasure to attend the second IS-GEO summer institute, in Hawaii. The meeting was led by Suzanne Pierce and Daniel Fuka, who managed to bring together more than 40 participants with different background and expertise. From the environmental sciences side, we had researchers specialized in areas such as Hydrology, Ecology or Meteorology. From the intelligent systems side, we had experts in sensor handling and deployment, data analytics, data integration, reproducibility and data visualization. We participated together by assembling and deploying hand-made sensors in the 8 different ecosystems of Hawaii’s Big Island. All while the volcano was still active and hurricane Hector approached from the south-east! But let me go step by step.
What is IS-GEO?
For those who are not familiar with the organization, IS-GEO (https://is-geo.org) is a Research Collaboration Network (RCN) funded by NSF through the EarthCube program that aims to bring together researchers from Intelligent Systems (IS) and Geosciences (GEO). The RCN has had presence in top conferences like AGU, where it has led a session for the last couple of years. In addition, we organize (yes, I am part of the RCN as well) monthly teleconferences where we invite an expert from either the IS or GEO side to talk about their latest research. Have a look here: https://is-geo.org/resources/research-presentations/
Exploring NEW research, not just exposing previous work
From the very beginning, the objectives of the event were made clear: collaborate together, define new challenges, enhance communication among attendants and finally define potential robust collaborations. These objectives are key in interdisciplinary conversations, as a fruitful collaboration will only happen when both sides are interested in different aspects of the same research problem. The program was structured so we would have a few presentations during the morning and then spend some times crafting sensors and deploying them in the afternoon. There were different teams with flexible structure and we spent quite some time in the vans when going to the field, which allowed everyone to talk to everyone else about their expertise and interests.
An unexpected guest: Hurricane Hector
Hurricane Hector introduced a change of plans. Instead of deploying just a few initial stations, we decided to prioritize sensor deployment during the first days, and then see if by the end of the week we could visualize actual data that could measure the impact of the hurricane. We had a quick introduction to the different type of sensors, and I was amazed how Arduino and open hardware initiatives have facilitated the integration and reading from them. It makes you want to create a small sensor station at your home!
Daily meteorological reports
One of the perks of being surrounded by scientists is that we had access to the local meteorologist, Harry Halpin, who provided reports of the movement of Hector every day before starting the sessions. Supercool!
It was also thanks to him that we were able to come close to the lava cam (http://lavacam.org/), which reports continuously about the status of the volcano. And take pictures of the recent lava burst, such as this one:

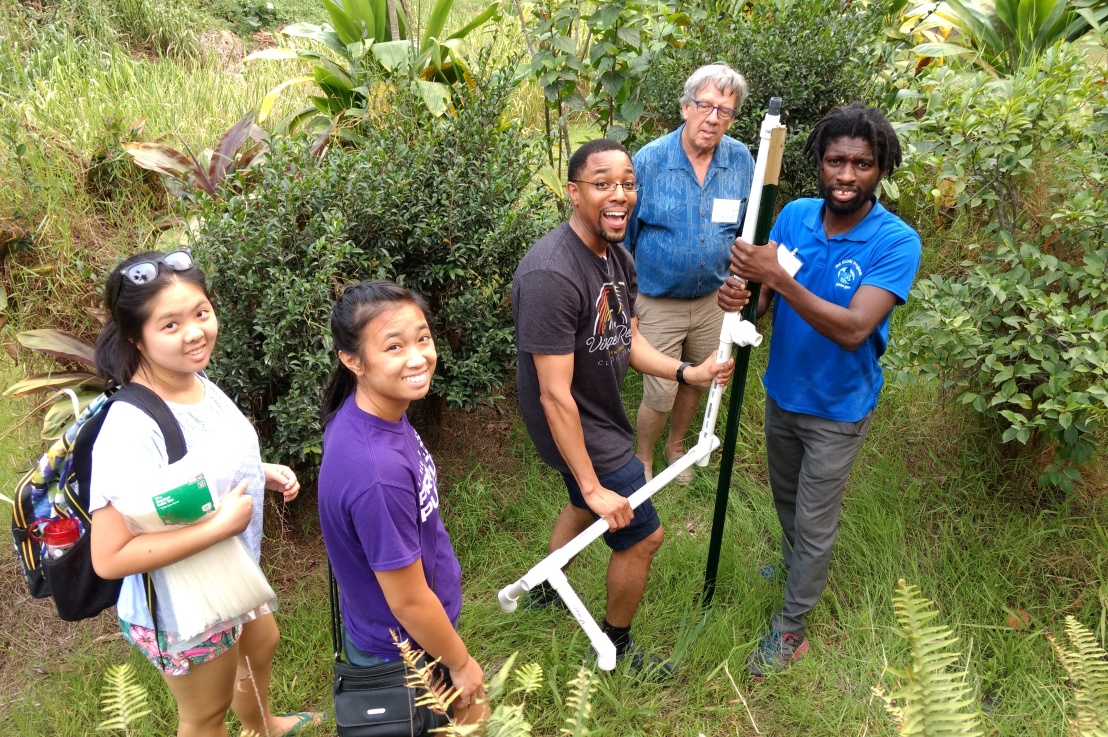
Building and planting sensors on the field:
We managed to deploy several sensor/weather stations in different ecosystems of the island. Some were deployed in some of the houses of the attendants, such as Dan Fuka’s backyard:
But some others were deployed in further points of the island. In this case, several attendants are setting up a weather station near a Buddhist temple:

Or near a mountain, on an old lava field. The dome is a research facility to simulate the living conditions in mars:

Visualizing data:
Once the stations were set, we connected them to the CHORDS platform and visualized them in a map (http://is-geo.chordsrt.com/sites/map). Mike Daniels explained how all data is available for download, and how to set up stations that register new data in CHORDS. Unfortunately, we didn’t have much time to do data analysis, but learning about the data acquisition process is a valuable lesson for all the attendants. Collecting data requires hard work, and integrating and visualizing it to make it useful is full of challenges, from sensor calibration to error detection.
Personal collaboration outcomes and takeaways:
I wish there were more events like this one, combining a potential asset to the community (a data product that reflects the impact of Hector and future hurricanes) with hands on sessions that explain how to create, program and collect data from sensors. I now appreciate more the amount of work that goes into the data collection process. Furthermore, I hadn’t created any circuit for a long time. It’s always good to refresh your memory with some Arduino hands on.
During the week, I also had the chance of collaborating with Suzanne Pierce and Daniel Hardesty-Lewis to create workflows for groundwater modeling. In fact, we were able to describe in a machine readable manner how to invoke Modflow with different recharge files and add it to a model registry. With a little more effort, we will be able to also connect this work to data collected by a platform such as CHORDS.
Other highlights:
- Planet Texas 2050 is going to be big! Created after hurricane Harvey’s disaster, this project is going to deploy a whole new cyberinfrastructure to study climate variations, track the impact of pumping and trying to predict how to irrigate different regions. I hope we can collaborate within our MINT project (see last bullet point)
- The Ronin Institute looks like a great organization to apply for research grants when you can’t change locations.
- IkeWai, like Planet Texas 2050, will set up a sensor infrastructure for data analysis. Many opportunities for data analysis!
- Privacy and sensor data: There are many open questions on who should own sensor data when installed on private property. On the one hand, sensors could give away personal information about the owner. On the other hand, sensors could be exploited to detect illegal activities, such as water pollution.
- Grafana is looking great for sensor data visualization. You can even configure alerts!
- [Self promotion :D] I gave a presentation and demo on our Model INTegration (MINT) project, where we are trying to bring together models from economy, agronomy, hydrology and meteorology to answer important questions about a region. The project is only 6 months old, but so far we are doing great progress! See our IEMSs paper for a full description of MINT!