The Knowledge Capture conference just finished last Friday, after two exciting days of presentations and keynotes. This year I was the Knowledge Graph chair at the conference, a position that we created in order to:
eat our own dog food by publishing structured data of papers and their associated code, data and ontologies;
track the adoption of Open Science good practices for every submission;
enabling future studies on Open Science, i.e., to see whether papers with open and accessible code and data are more cited in the long term.
As a result of our efforts, we published an enhanced list of accepted papers, which complement the proceedings by making it easy to access the data, code and ontologies of accepted papers. The results are also available in RDF, and were well received by other authors:
In this blog post I will summarize how we created the Knoweldge Graph, what sources of data were used and which parts had to be manually curated. I will also summarize the results from the papers we received, and outline some lessons learned that I hope we can use to improve the next conference.
Datasets and methods: In order to transform the data to RDF, I looked into the CSVs generated by Easychair. These CSVs are pretty standard: each row had an instance, and each column a potential metadata field. We had one CSV for the authors and their metadata, another one for the papers accepted (the other chairs had created this one and added common topics); and another one with the resources associated to each paper. Unfortunately, the CSV with the resources had all the metadata provided by the authors in a single field, so I had to split it by hand and curate its contents with the links provided by the authors.
Note that these CSVs were based on the camera-ready submissions done by the authors and were assumed to be complete: I did not go through each accepted paper to see if additional datasets were defined in the paper.
Next, I looked into existing ontologies to model authors, papers and their metadata, by looking into LOV. I found the Semantic Web Conference ontology, which looked good, but was not available anymore (I missed its refactored version). Therefore I turned to Schema.org, which had concepts for papers, datasets, code, and authors and their basic metadata, so I ended up using that vocabulary for the KG.
I converted CSV to RDF by using RML mappings, which worked well but took a little more than I expected to put together. I faced a challenge when assigning the rdf:type to a paper resource, because I wanted to assign its type based on a cell value, and the first two tools I used produced errors in this case. I ended up using Morph-KGC, which worked beautifully and created the final RDF very quickly.
Finally, I created a couple of Python scripts to generate the HTML I needed to copy and paste into the final HTML. I decided this was the fastest approach because both the program and accepted paper page had already been created. In addition, the simple modeling done for the authors did not capture their position (i.e., who is first author, second, etc.); and therefore the RDF is not enough for generating an ordered list of the authors. This can be overcome by using RDF* or n-ary relationships, and it’s something to bear in mind for the next K-CAP edition.
The figure below summarizes the tools and process followed to deliver the final RDF:
Results: A total of 41 papers were accepted in K-CAP. 35 of them had one or multiple resources associated with them, with a total of 69 resources. The resource distribution can be seen in the image below:
This is excellent news, as most accepted papers had (part of) their resources available. But how were these resources shared? The figure below sheds more light into the Open Science practices followed by the authors.
Number of papers with resources with license and DOIs respectively
As shown in the figure above, from the 41 accepted papers, more than 40% (18) did not have a license associated with one or more of their resources. This worsens when looking at the resources themselves: from 69 reported resources, only 24 had a license. This means that we still have to improve as a community when sharing resources. Not specifying a license means that by default our resources cannot be reused by others (by default, everything has an “all rights reserved” license). This omission strikes as odd to me, as in many cases the authors have done their homework to make their resource accessible and available on the web to others.
Regarding the usage of permanent identifiers, only 2 out out 41 papers provided DOIs or permanent URLs to their resources. Once again, there is room for improvement here, as having a permanent identifier associated with a dataset/code is crucial for reproducibility and enabling proper credit for the resource. For example, 16 papers used GitHub/Gitlab to share their data without a proper release, which means that the data could change tomorrow and make the results of the paper inconsistent. In addition, it is difficult to cite only the dataset when it’s part of a full code repository.
Lessons learned: This year the metadata was collected by using some of the forms in Easychair. One of the problems I see is that the form we proposed made it too difficult to process data in an automated manner, having to manually create columns for each of the metadata fields and resources needed.
For example, this was a sample collected row:
no.
Data Availability
Data1: doi: DOI LINK. Data 2: DOI LINK, LICENSE
Sample of the form used to gather metadata this year
There are two main problems with this design:
If there is more than one resource, it’s difficult to separate them automatically.
Each resource is described with name, URL, DOI and license (if available) in the same cell, making it hard to separate automatically.
Nobody likes filling forms, and I think we should ask for minimal metadata from authors (without parsing automatically the pdfs). Ideally, if a DOI/URI was provided we could leverage it to retrieve all the metadata and citation automatically. If a form is used in the future, we should emphasize the need for minting permanent URLs/DOIs and using open licenses; and having one resource per cell in the form.
And that’s it! I really liked performing this exercise, and I think the results will help authors and the community access the resources of papers in an easier manner. I hope we can inspire other conferences to carry out similar efforts. Send me an email if I can help.
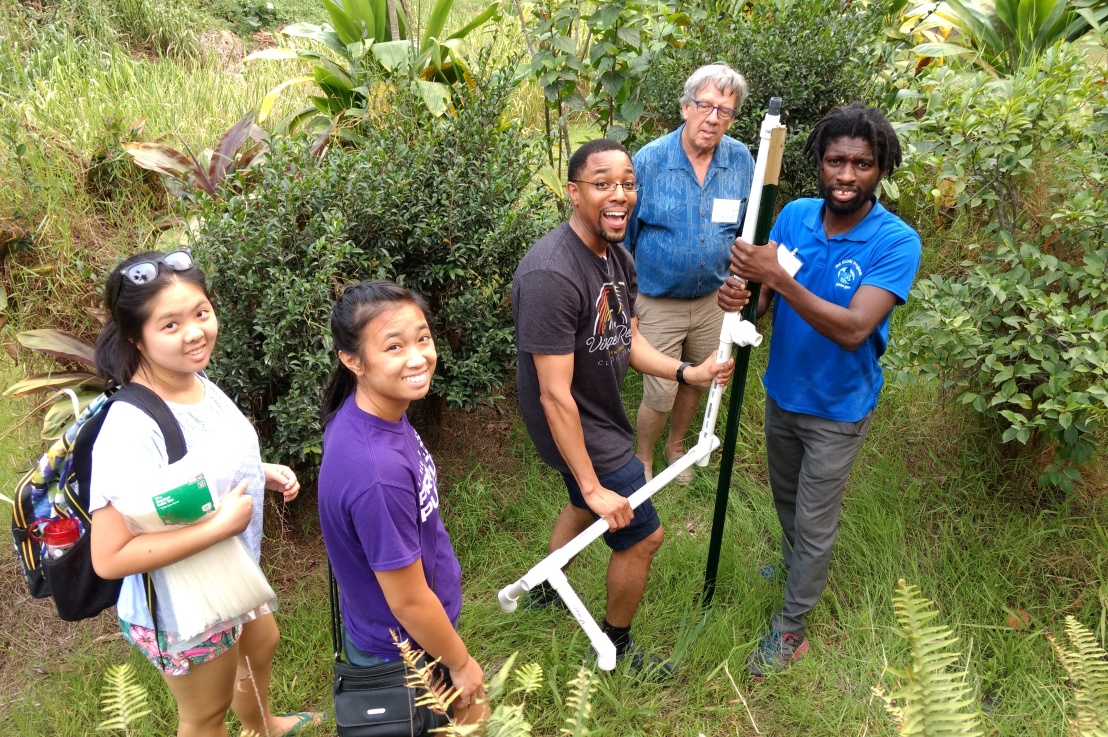
A few weeks ago I had the pleasure to attend the second IS-GEO summer institute, in Hawaii. The meeting was led by Suzanne Pierce and Daniel Fuka, who managed to bring together more than 40 participants with different background and expertise. From the environmental sciences side, we had researchers specialized in areas such as Hydrology, Ecology or Meteorology. From the intelligent systems side, we had experts in sensor handling and deployment, data analytics, data integration, reproducibility and data visualization. We participated together by assembling and deploying hand-made sensors in the 8 different ecosystems of Hawaii’s Big Island. All while the volcano was still active and hurricane Hector approached from the south-east! But let me go step by step.
What is IS-GEO?
For those who are not familiar with the organization, IS-GEO (https://is-geo.org) is a Research Collaboration Network (RCN) funded by NSF through the EarthCube program that aims to bring together researchers from Intelligent Systems (IS) and Geosciences (GEO). The RCN has had presence in top conferences like AGU, where it has led a session for the last couple of years. In addition, we organize (yes, I am part of the RCN as well) monthly teleconferences where we invite an expert from either the IS or GEO side to talk about their latest research. Have a look here: https://is-geo.org/resources/research-presentations/
Exploring NEW research, not just exposing previous work
From the very beginning, the objectives of the event were made clear: collaborate together, define new challenges, enhance communication among attendants and finally define potential robust collaborations. These objectives are key in interdisciplinary conversations, as a fruitful collaboration will only happen when both sides are interested in different aspects of the same research problem. The program was structured so we would have a few presentations during the morning and then spend some times crafting sensors and deploying them in the afternoon. There were different teams with flexible structure and we spent quite some time in the vans when going to the field, which allowed everyone to talk to everyone else about their expertise and interests.
An unexpected guest: Hurricane Hector
Hurricane Hector introduced a change of plans. Instead of deploying just a few initial stations, we decided to prioritize sensor deployment during the first days, and then see if by the end of the week we could visualize actual data that could measure the impact of the hurricane. We had a quick introduction to the different type of sensors, and I was amazed how Arduino and open hardware initiatives have facilitated the integration and reading from them. It makes you want to create a small sensor station at your home!
One of the perks of being surrounded by scientists is that we had access to the local meteorologist, Harry Halpin, who provided reports of the movement of Hector every day before starting the sessions. Supercool!
It was also thanks to him that we were able to come close to the lava cam (http://lavacam.org/), which reports continuously about the status of the volcano. And take pictures of the recent lava burst, such as this one:
Building and planting sensors on the field:
We managed to deploy several sensor/weather stations in different ecosystems of the island. Some were deployed in some of the houses of the attendants, such as Dan Fuka’s backyard:
But some others were deployed in further points of the island. In this case, several attendants are setting up a weather station near a Buddhist temple:
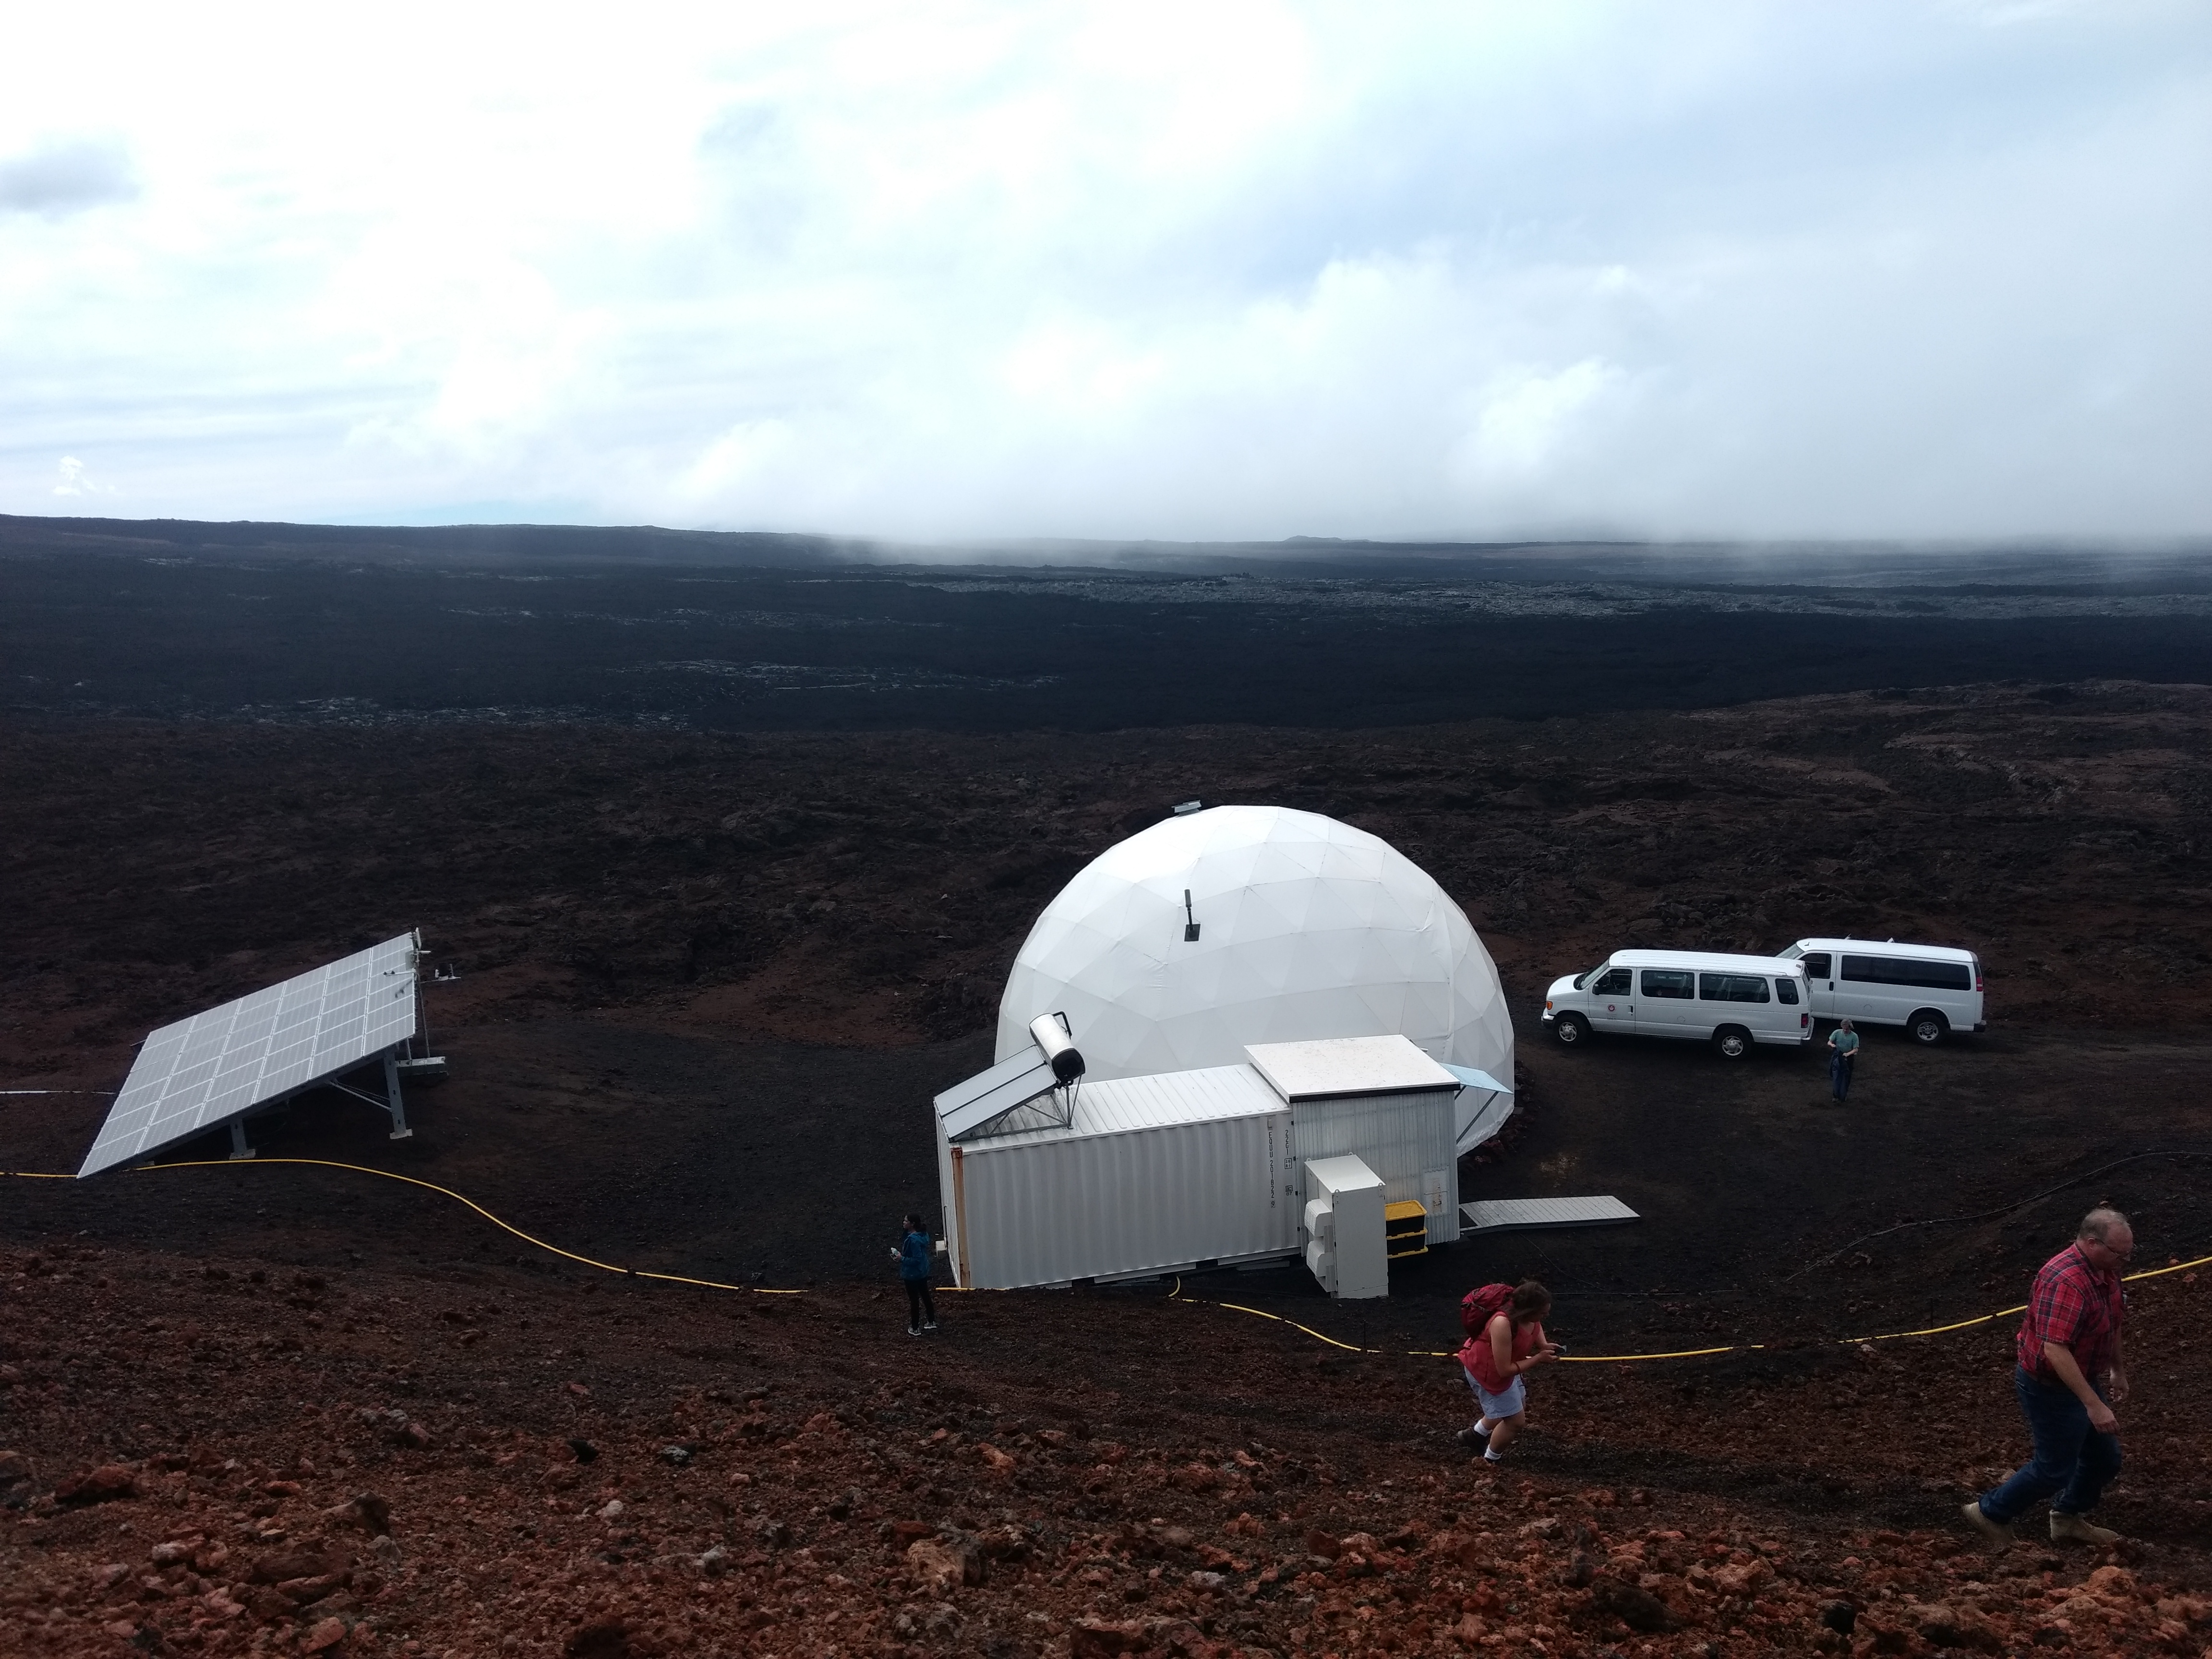
Or near a mountain, on an old lava field. The dome is a research facility to simulate the living conditions in mars:
Visualizing data:
Once the stations were set, we connected them to the CHORDS platform and visualized them in a map (http://is-geo.chordsrt.com/sites/map). Mike Daniels explained how all data is available for download, and how to set up stations that register new data in CHORDS. Unfortunately, we didn’t have much time to do data analysis, but learning about the data acquisition process is a valuable lesson for all the attendants. Collecting data requires hard work, and integrating and visualizing it to make it useful is full of challenges, from sensor calibration to error detection.
Personal collaboration outcomes and takeaways:
I wish there were more events like this one, combining a potential asset to the community (a data product that reflects the impact of Hector and future hurricanes) with hands on sessions that explain how to create, program and collect data from sensors. I now appreciate more the amount of work that goes into the data collection process. Furthermore, I hadn’t created any circuit for a long time. It’s always good to refresh your memory with some Arduino hands on.
During the week, I also had the chance of collaborating with Suzanne Pierce and Daniel Hardesty-Lewis to create workflows for groundwater modeling. In fact, we were able to describe in a machine readable manner how to invoke Modflow with different recharge files and add it to a model registry. With a little more effort, we will be able to also connect this work to data collected by a platform such as CHORDS.
Other highlights:
Planet Texas 2050 is going to be big! Created after hurricane Harvey’s disaster, this project is going to deploy a whole new cyberinfrastructure to study climate variations, track the impact of pumping and trying to predict how to irrigate different regions. I hope we can collaborate within our MINT project (see last bullet point)
The Ronin Institute looks like a great organization to apply for research grants when you can’t change locations.
IkeWai, like Planet Texas 2050, will set up a sensor infrastructure for data analysis. Many opportunities for data analysis!
Privacy and sensor data: There are many open questions on who should own sensor data when installed on private property. On the one hand, sensors could give away personal information about the owner. On the other hand, sensors could be exploited to detect illegal activities, such as water pollution.
Grafana is looking great for sensor data visualization. You can even configure alerts!
[Self promotion :D] I gave a presentation and demo on our Model INTegration (MINT) project, where we are trying to bring together models from economy, agronomy, hydrology and meteorology to answer important questions about a region. The project is only 6 months old, but so far we are doing great progress! See our IEMSs paper for a full description of MINT!
Last week I attended the 9th edition of iEMSs in Fort Collins, Denver. IEMSs is a bi-annual conference that brings together between 300 and 400 researchers from software engineering, intelligent systems, environmental modeling and decision making domains (among others). There were very few people that knew about ontologies and Semantic Web, which makes it a unique experience to learn about the problems from other communities. Going to this kind of events (outside of your community of expertise) has been eye opening for me in the past, and I cannot recommend it enough. Get out of your community bubble once in a while J
What was I doing at iEMSs?
I attended the conference to present 3 papers about our Model Integration project (MINT). The papers describe an overview of the project, in which we aim to reduce the time required to integrate together models from climate, hydrology, agriculture, economics and social sciences. In addition, we introduce a new approach to describe model variables and processes using the Ontosoft software registry and our plan to integrate Pegasus and Emely for efficient model coupling. More information is available in the conference program (hopefully our papers will soon be available in the conference proceedings as well). Overall, the presentations were well received and I was glad to learn that there is huge interest in some of the problems we are tackling, such as the description of models to facilitate their reusability or enabling model coupling.
AWESOME Keynotes
One of the best parts of the conference were the keynotes. Temple Grandin started on Monday with a cry for acceptance of visual thinkers (“I see risk, other people try to measure it!”) together with the need to get closer to the infrastructure we use every day. Get out of the office and get your hands dirty once in a while!
"A little bit of autism gives you Engineering". Loving Temple Grandin's keynote at #iEMSs2018 in beautiful Fort Collins, CO. pic.twitter.com/egkTTNXB2n
Nick Clinton followed up on Tuesday with an introduction to Google Earth (see slides). It looks like Google has invested a lot into bringing together earth data (more than 7 PB) and infrastructure to create an environment for scientist to do their science. All for free (for researchers), using Javascript and Python interfaces and with access to a bunch of machine learning algorithms. It’s also easy to create time lapses of areas of interest, allowing to show real time evolution of parts of earth for the last 30 years.
The last keynote speaker was Thomas Vilsack, former US Secretary of Agriculture under the Obama administration. This is the first keynote I have seen given by a politician, with no slides and a direct but compelling speech. The speaker tackled several problems related to modeling, from the role of science in different debates (GMOs and climate change) to the need for new sustainable solutions given the increase of population around the globe. How can we make models that convince farmers and policy makers about the long term consequences of their actions? How can models be used to increase the productivity per individual acre? Can we find solutions so we become better consumers of food? How can we reduce and reuse food waste?
Excellent wake up call from former US Secretary of Agriculture, Thomas Vilsack on conflicting short- and -long term challenges in Agriculture- e.g. ecosystem markets #iEMSs2018pic.twitter.com/fjEa6r4V7m
Given that many sessions happened in parallel, this is a personal vision with the highlights of the talks I attended to:
Ibrahim Demir’s FloodAI is a very cool approach that mixes science with visual explanations early detection observations. They have done an impressive amount of work to be able to communicate their results with chat bots. No wonder why he won a conference award!
Alexei Voinov described surveys, tools and methods for participatory modeling. Remaining challenges are a) people tend to use the tools and models they are more familiar with, rather than experiment new ones in different contexts; b) Failure in method execution is not reported.
Ruth Falconer (University of Abertay) and the use of videogames in environmental modeling.
Eric Hutton (CSDMS) introduced PYMT, a model coupling framework in Python.
RODOS, an European decision support system designed as a consequence of Chernobyl’s nuclear accident. There are so many different processes involved, from wind to soil deposition of contamination.
The Nexus tools platform for model comparison. Currently they have 84 models and counting!
Sarah Mubareka’s report on integration of models of biomass supply. Creating accurate indicators for estimating biomass in Europe is a real challenge, as everyone one uses different definitions and metrics in their country.
Natalia Villanueva’s interface for scenario simulation in Rio Grande. I really like the effort they have put into make their results understandable by stakeholders.
TMDL, a mechanism to remediate impaired water bodies
Last week I attended the annual EarthCube All Hands Meeting (ECAHM) in Alexandria, Washington. Since it’s been a while since I last wrote my last post, I think it would be interesting to share my notes and highlights here for anyone who missed the event.
ECAHM meetings are usually very enriching experiences, as they bring together a variety of researchers from different fields related to geosciences, ranging from computer scientists to volcanologists or marine biologists. The purpose of the meeting is to gather the community together and hear everyone report back from their EarthCube NSF funded projects, which are targeted towards improving cyber-infrastructure in the geosciences. As a computer scientist, I think this is a great meeting to attend for two main reasons: first, you always learn something new, even if it’s not in your domain. Second, people are extremely grateful to your contributions, as you are helping them become more effective when doing their science.
So, what was I doing at ECAHM 2018?
I attended the meeting to present our latest progress in OntoSoft, a distributed software metadata registry we created at ISI to facilitate scientists describe their software. You can see the poster abstract online (and soon the poster itself). I also participated on a “speed-dating session”, where I got to discuss for half an hour how to describe software with a domain scientist; and I substituted Yolanda Gil in a panel for external partnership opportunities, where I presented the Open Knowledge Network initiative. This effort, led by NITRD, is a great opportunity of creating a shared open knowledge graph that would be used for both research and industry to refine and curate its contents. The idea is that this knowledge graph becomes part of the US infrastructure the same way supercomputers currently are, so anyone could benefit from it and also contribute to it. It looks like the NSF is keen to pursue this objective too.
Two colleagues of mine also presented other initiatives I am involved in. Deborah Khider showcased our efforts towards structuring metadata and creating standards in the paleoclimate sciences, together with a set of tools that a team of paleo-climate scientists have developed to work with that structured data. She also managed to mix Star Wars and Star Trek themes in her poster and presentation, which was well received by the attendants (I think everyone stopped at her poster)
As expected, keynotes at ECAHM are nothing like venues such as AAAI or IUI. The first speaker was Dean Pesnell (NASA) and he presented the research carried out by his team on studying the sun and sun spots. Why is this related to geosciences? Because the sun could be considered “our ground truth for the universe”, and anything related to its activity has many implications in any of the fields of geosciences. Their main problem is how to analyze the amount of data that they have. Each of their datasets may contain several hundred million images, so proper metadata is crucial (you don’t want to find out you have downloaded 300 million images for nothing). Dean showed some impressive videos of their observations of the sun, as well as their pipelines to handle “very big data” analyses.
The second speaker was Sarah Stamps, and she talked about continental rift and the Tanzania Volcano observatory. Apparently, geologists are one of the few people in the word who would run towards an erupting volcano, instead of away from it. Sarah described the EARS system (East African Rift System) they are setting up, and how they teamed up with CHORDS to enable real time analysis of the observations they measure on the field. Thanks to her work, they are developing an early warning system for hazard detection! Sarah was departing soon to set a few more observing stations in the field, so best of luck!!
The third speaker was Caroline S. Wagner, who gave some metrics on the social side of interdisciplinary collaboration across disciplines. Science has become increasingly collaborative and team based, and the number of international collaborations have doubled in the past years. The number of countries producing 95% of research has gone from 7 to 15, which indicates we are moving in the right direction. However, more than 50% of the articles are currently never cited. A few takeaways from this talk are: 1) International collaborations start face to face, so go to different events and meet new people; 2) Diverse teams usually take longer to be productive, as people don’t usually speak the same language. Be patient!!; 3) Work towards a solution, not towards interdisciplinar teams. Interdisciplinarity should be the means to an end, not the end itself.
Other highlights
Below are some additional highlights I found interesting for the EarthCube community.
Eva Zanzerika reported on the NSF 10 Big Ideas, which nicely summarize the interests of the agency in terms of funding in the next years. The report has been out since more than 1 year ago, but it’s never too late to catch up!
Doug Fils presented their plan for turning P418 turning into something bigger. In case you don’t know, P418 currently tracks the metadata of datasets exposed as schema.org and aggregates it in a search engine (a search engine for scientific data). Future plans are to ingest other types of resources and make the code base stable.
Interesting working lunch idea: A napkin drawing exercise. Do you know how to present your idea with a simple sketch?
PANGEO: Big data in the geosciences (but without reinventing the wheel!)
ASSET: Or how to incorporate existing tools into your workflows by drawing sketches! Workflows are important! Two different studies may obtain results even if the original data is the same:
I have just returned from an amazing IUI2017 in Limassol, Cyprus and, as I have done with other conferences, I think it would be useful to share a summary of my notes in this post. This was my first time attending the IUI conference, and I am gladly surprised with both the quality of the event and friendliness of the community. As a Semantic Web researcher, it was also very positive to learn how problems are tackled from a human-computer interaction perspective. I have to admit that this is often overlooked in many semantic web applications.
What was I doing in IUI2017?
My role in the conference was to present our paper towards the generation of data narratives, or, in a more ambitious manner, our attempt to write the “methods” section of a paper automatically (see some examples here). The idea is simple: in computational experiments, the inputs, methods (i.e., scientific workflows), intermediate results, outputs and provenance are explicit in the experiment. However, scientists have to process all these data by themselves and summarize it in the paper. By doing so, they may omit important details that are critical for reusing or reproducing the work. Instead, our approach aims to use all the resources that are explicit in the experiment to generate accurate textual descriptions in an automated way.
I wanted to attend the conference in part to receive feedback on our current approach. Although our work was well received, I learned that the problem can get complex really quickly. In fact, I think it can become a whole area of research itself! I hope to see more approaches in the future in this direction. But that is the topic for another post. Let’s continue with the rest of the conference:
Keynotes
The conference lasted three days, with one main keynote opening each of them. The conference opened with Shumin Zhain, from Google, who described their work on modern touchscreen keyboard interfaces. This will ring a bell to anyone reading this post, as the result of their work can be seen on any Android phone nowadays. I am sure they will not have problems finding users to evaluate their approaches.
In particular, the speaker introduced the system to capture gestures to recognize words, as if you were drawing a line. Apparently, before 2004 they had been playing around with different keyboard configurations that helped users write in a more efficient manner. However, people have different finger sizes, and adapting the keyboard to them is still a challenge. Current systems have several user models, and combine them to adapt to different situations. It was in 2004 when they came with the first prototype of SHARK, a shape writer that used neural networks to decode keyboard movements. They refined their prototype until achieving the result that we see today on every phone.
However, there are still many challenges remaining. Smart watches have a screen that is too small for writing. And new formats without screen such as wearable devices or virtual reality don’t use standard keyboards. Eye tracking solutions have not made significant progress, and while speech recognition has evolved a lot, it is not likely to replace traditional writers any time soon.
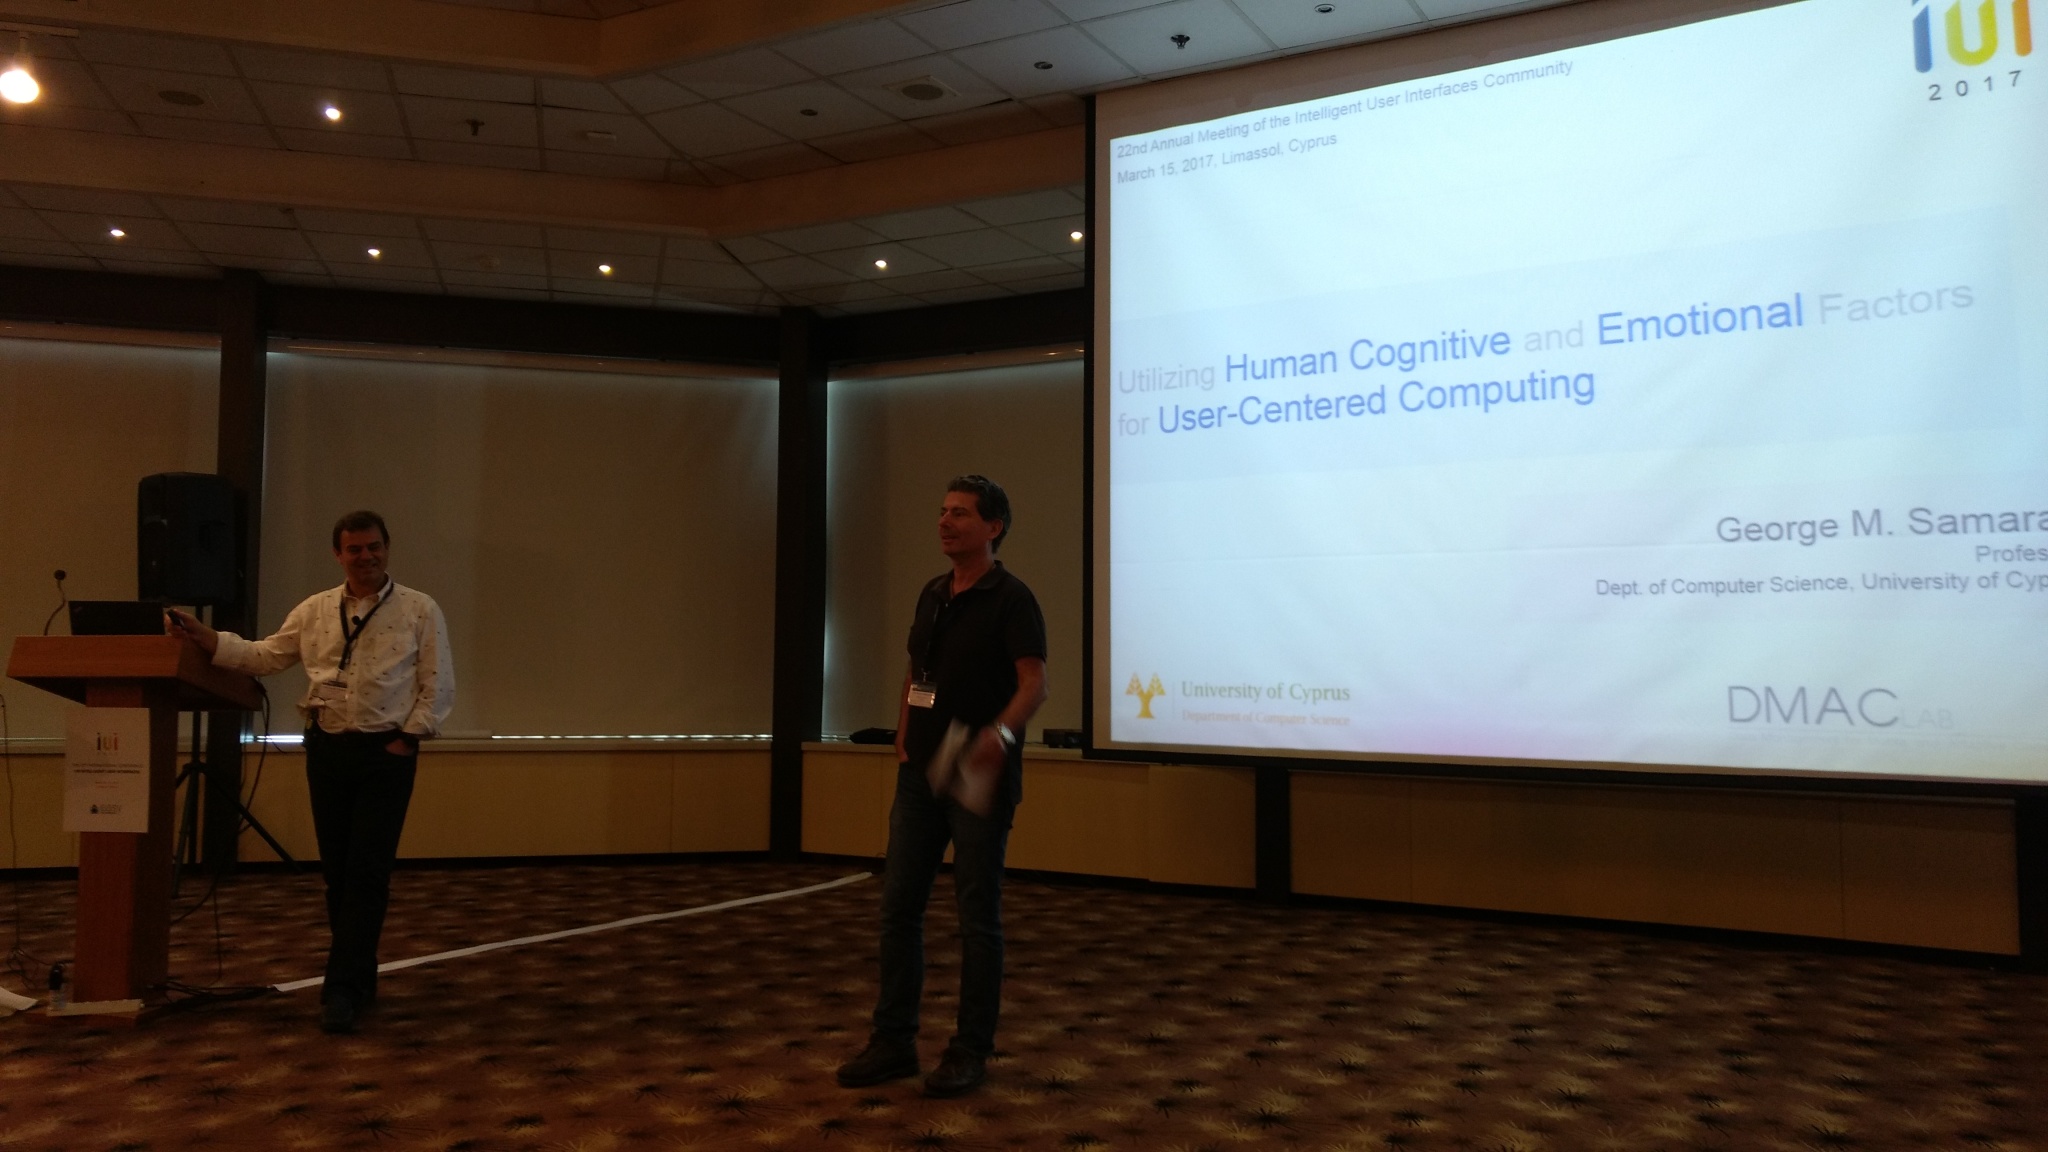
The second speakers was George Samaras, who described their work to personalize interfaces based on the emotions shown by the users of a system. The motivation for this need is that currently an 80% of the errors of automated systems are due to human mistakes rather than mechanical ones, especially when the interfaces are complex, such as in aviation or nuclear plants. Here cognitive systems are crucial, and adapting the content and navigation to the humans using them becomes a priority.
The speaker presented their framework to classify users based on the relevant factors in interfaces. For example, the verbals prefer textual explanations, while imagers like image explanations for e.g., browsing results. Another example is how users prefer to explore the results: we have the wholist, who prefer a top down exploration, versus the analysit, who would rather go for bottom up search. This is can become an issue in collaborations, as users that prefer to perceive the information in the same way may collaborate more efficiently together. A study performed over 10 years with more than 1500 shows that personalized interfaces lead to a faster task completion.
Finally, the speaker presented their work for tackling the emotions of users. Recognizing them is important, as depending on their mood, users may be keen to see the interface in one way or the other. They have developed a set of cognitive agents, which aim to personalize services and persuade users to complete certain tasks. Persuasion is more efficient when taking into account emotions as well.
The final keynote was presented by Panos Markopoulos, who introduced their work on hci design for patient rehabilitation. Having a proper interaction with patients (in exercises for kids and elderly people, arm training for stroke survivors, etc.) is critical for their recovery. However, this interaction has to be meaningful or patients will get bored and not complete their recovery exercises. The speaker described their work with therapists to track patient recovery in exercises such as pouring wine, cleaning windows, etc. The talk ended with a summary of some of the current challenges in this area, such as adapting feedback from patient behavior, sustaining engagement on the long run or personalization of exercises.
Highlights
Recommendation is still a major topic in HCI. Peter Brusilovsky gave a nice overview of their work on personalization in the context of relevance-based visualization, as part of the ESIDA workshop. Personalized visualizations are now gaining more relevance in recommendation, but picking the right visualization for users is still a challenge. In addition, users are starting to demand why certain recommendations are more relevant, so non-symbolic approaches like topic modeling present issues.
Semantic web as a means to address curiosity in recommendations. SIRUP uses LOD paths with cosine similarity to find potential connections relevant for users.
Most influential paper award: Trust in recommender systems (O’Donovan and Smyth), where they developed a trust model for users, taking into account provenance too. Congrats!
Exploration of datasets from natural language queries. Christina Christodoulakis presented an approach to help analysts explore the next query to perform based on previous queries. A cool feature being explored here is that they abstract queries using hierarchies (e.g., what is a “sum of money over period of time” instead of “revenue per month”). Kevin McCurley introduced Analyza, an impressive effort led by Google to explore data with conversation. Originally motivated to simplify complex interfaces when retrieving data from CSVs, they have developed a virtual data analyst that breaks down queries into smaller pieces to help users translating their natural language questions to database queries. I wonder if we will see this feature soon in Google spreadsheets, as it looks tremendously useful.
The gala dinner showed me something: the people of Cyprus know how to eat. It is the first time I see a table so full of food. And new dishes they kept coming! It felt like the meal of Mannekenpix, one of the 12 tasks of Asterix.
Conclusions
IUI 2017 had 193 participants this year, almost half of them students (86); and an acceptance rate of 23% (27% for full papers). You can check the program for more details. I usually prefer this kind of conferences because they are relatively small, you can see most of the presented work without having to choose and you can talk to everyone very easily. If I can, I will definitely come back.
I also hope to see more influence of Semantic Web techniques to facilitate some of the challenges in HCI, as I think it there is a lot of potential to help in explanation, trust or personalization. I look forward to attending next year in Tokyo!
The Association for the Advancement of Artificial Intelligence conference (AAAI) is held once a year to bring together experts from heterogeneous fields of AI and discuss their latest work. It is also a great venue if you are looking for a new job, as different companies and institutions often announce open positions. Last week, the 31st edition of the conference was celebrated in downtown San Francisco, and I attended the whole event. If you missed the conference and are curious about what was going on, make sure you read the rest of this post.
But first: what was I doing there?
I attended the conference to co-present a tutorial and a poster.
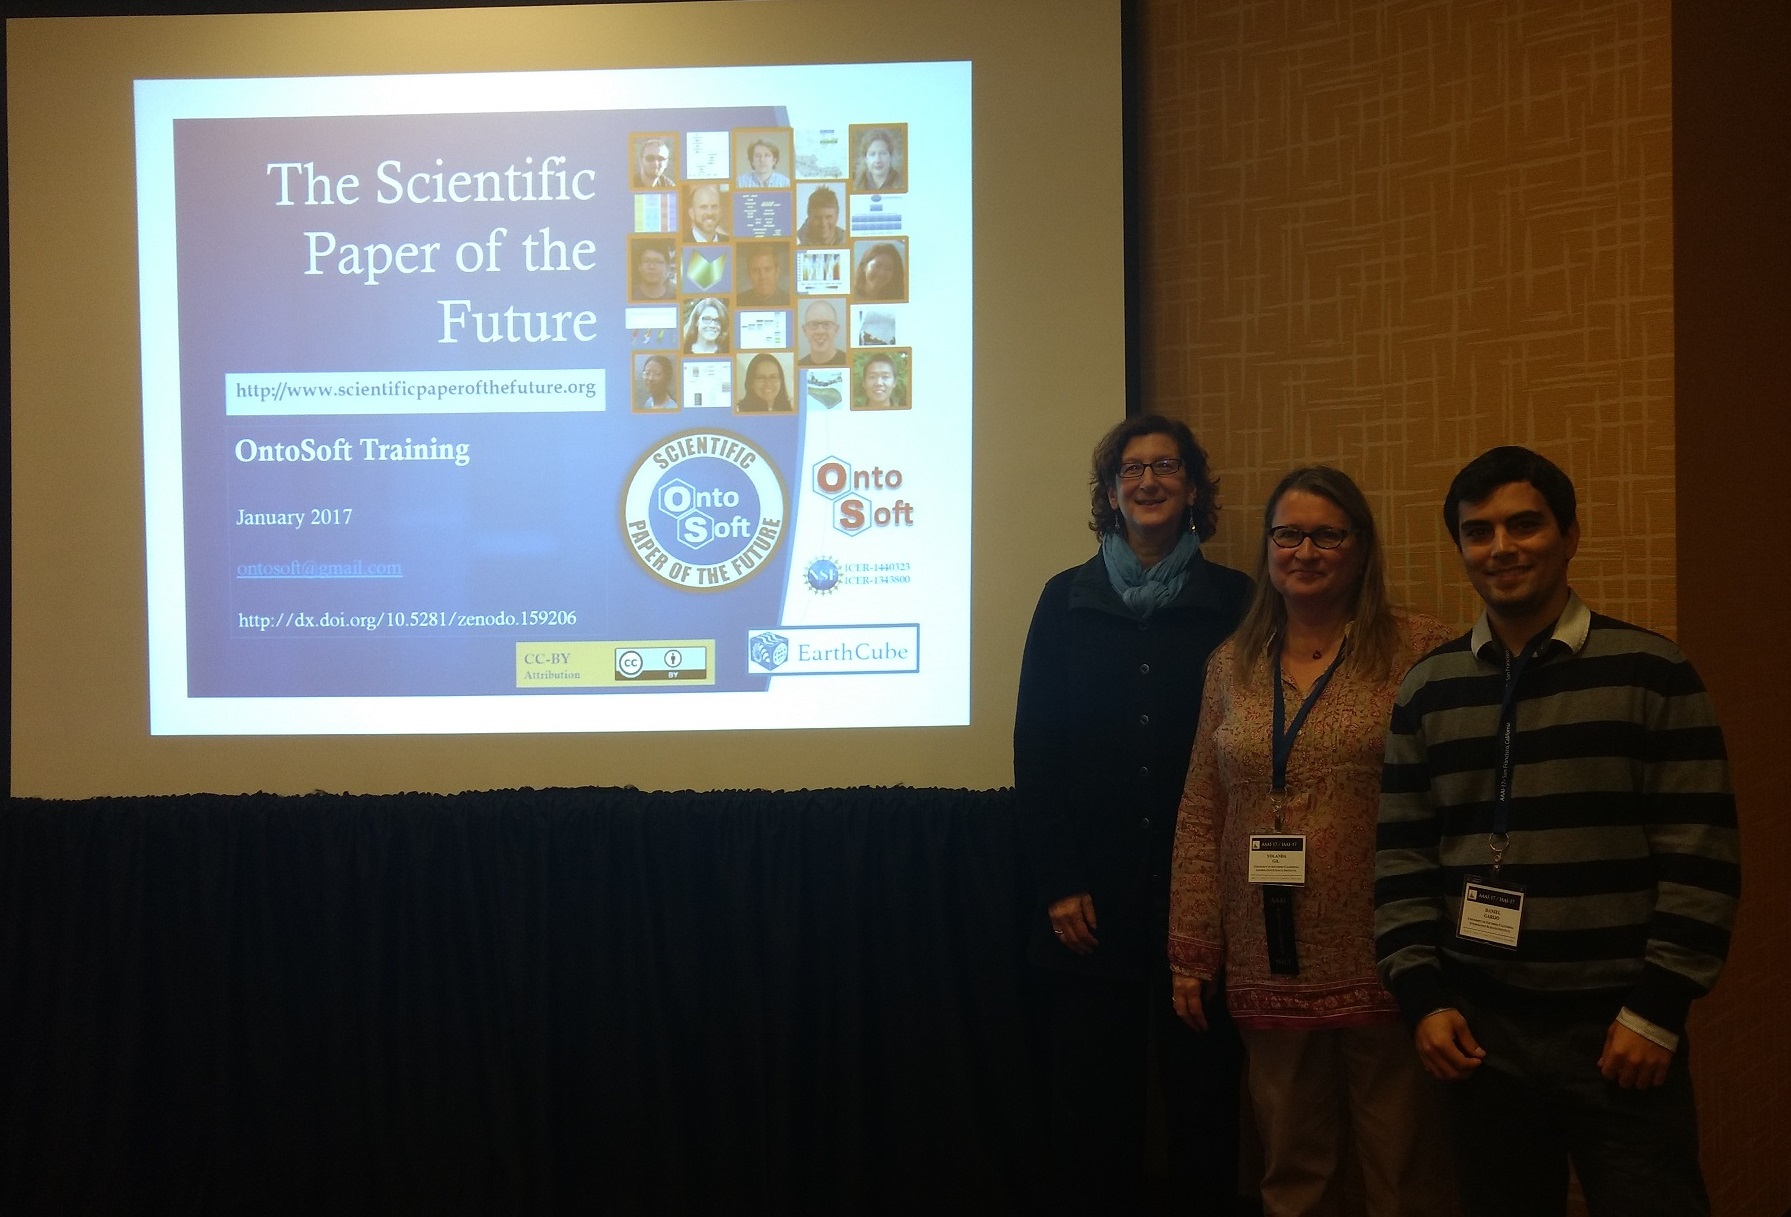
The tutorial was a training session called “The scientific paper of the future”, which introduced a set of best practices on how to describe data, software, metadata, methods and provenance associated with a scientific publication, along with different ways of implementing these practices. Yolanda Gil and I presented, but Gail Clement (lead of AuthorCarpentry at Caltech library) joined us as well to describe how to boost your research impact in 5 simple steps. I found some of her materials so useful that I have finally opened a profile on ImpactStory after her talk. All the materials of our talk are online, so feel free to check them out.
From left to right: Gail Clement, Yolanda Gil and me
The poster I presented described the latest additions of the DISK framework. In a nutshell, we have adapted our system for automating hypothesis analysis and revision to operate on data that is constantly growing. While doing this, we keep a detailed record of the inputs, outputs and workflows needed to do the revision of the hypothesis. Check out our paper for details!
Ok, enough self-promotion! Let’s get started with the conference:
Keynotes
In general, the quality of the keynotes and talks was outstanding. The presenters did a great job and effort to talk about their topics without jumping into the details of their field.
Rosalind Piccard started the week by talking about AI and emotions, or, using her own terms, “affective computing”. Detecting the emotion of the person interacting with the system is pivotal for decision making. But recognizing these emotions is not trivial (e.g., many people smile when they are frustrated, or even angry). It’s impressive how sometimes just training neural networks with sample data is not enough, as the history of the gestures play an important role in the detection as well. Rosalind described her work for detecting and predict emotions like the interest of an audience or stress. Thanks to a smart wristband they are able to predict seizures and breakouts in autistic kids. In the future, they aim to be able to predict your mood and possible depressions!
On Tuesday, the morning keynote was given by Steve Young, who talked about speech recognition and human-bots interaction. Their approach is mostly based on neural networks and reinforced learning. Curiously enough, this approach works better on the field (with real users) than with simulated results (for which other approaches work better). The challenges in this area lie in determining when a dialog is not accurate, as users tend to lie a lot when providing feedback. In fact, maybe the only way of knowing that something went wrong in a dialog is when it’s too late and the dialog has failed. As a person working on the Semantic Web domain, I found interesting that knowledge bases are an uncharted territory in this field at the moment.
Jeremy Frank spoke in the afternoon session for IAAI. He focused on the role of AI on autonomous space missions where sometimes the communications are interrupted and many anomalies may occur. The challenge in this case is not only to be able to plan what the robot or ship are going to do, but to monitor the plan and explain whether an order or a command did what it was actually supposed to. In this scenario, having new software becomes a risk.
On Wednesday, Dmitri Dolgov was in charge of talking about self-driving cars. More than 10 trillion miles are travelled every year across the world, with over 1.2 million casualties in accidents that are 94% of the time a human error. The speaker gave a great overview of the evolution of the field, starting in 2009 when they wanted to understand the problem and created a series of challenges to drive 100 miles in different scenarios. By 2010, they had developed a system good enough for driving a blind man across town, automatically. In 2012, the system was robust enough to drive in freeways. By 2015, they had finally achieved their goal: a complete driverless vehicle, without steering wheel or pedals. A capability of the system that surprised me is that it is able to read and mimic human behavior in intersections or stop signs without any trouble. In order to do this, the sensor data has to be very accurate, so they ended up creating their own sensors and hardware. As in the other talks, deep learning techniques have helped enormously to recognize certain scenarios and operate accordingly. Having the sensor data available has also helped. These cars have more than 1 billion virtual miles of training, and they are failing less and less as time goes by.
The afternoon session was led by Kristen Grauman, an expert in computer vision who analyzed how image recognition works in unlabeled video. The key challenge in this case is to be able to learn from images in a more natural way, as animals do. It turns out that our movement is heavily correlated to our vision sense, to the point that if we don’t allow an animal to move freely when it’s growing up and viewing the world, it may be damaged permanently. Therefore, maybe machines should learn from images in movement (videos) to understand better the context of an image. The first results in this direction look promising, and the system has so far learned to track relevant moving objects in video, by itself.
The final day opened with a panel that I am going to include in the keynote group, as it has been one of the breakthroughs of this year. An AI has recently beaten all the professional players against whom it has played in Poker (one to one), and two of the lead researchers in the field (Michael Bowling and Tuomas Sandholm) were invited to show us how they did it. Michael started describing DeepStack and why Poker is a particularly interesting challenge for AI: while in other games like chess you have all the information you need at a given state to decide your next move, Poker is an imperfect information game. You may have to remember the history of what has been done in order to proceed with your next decision. This creates a decision tree that is even bigger than complex board games like Chess and Go, so researchers have to abstract and explore the sparse tree. The problem is that, at some point, something may have happened that wasn’t taken into account in the abstraction, and this is where the problems start.
Their approach for addressing this issue is to reason over the possible cards that the opponent thinks the system has (game theory and Nash equilibrium play a crucial role). The previous history determines distributions of the cards, while evaluation functions have different heuristics based on the beliefs of the players in the current game (deep learning is used to choose the winning situation out of the possibilities). While current strategies are very exploitable, DeepStack is one of the least, being able to make 8 times what a regular player makes while being able to run in a laptop during the competition (the training part takes place before).
Tuomas followed introducing Libratus, an AI created last year but evolved from previous efforts. Libratus shares some strategies with DeepStack (card abstraction, etc.), as the Poker community has worked together on interoperable solutions. Libratus is the AI that actually played against the Poker professionals and beat them, even when they had a 200K $ incentive for the winner. The speaker mentioned that instead of trying to exploit the weaknesses of the opponent, Libratus focused on how the opponent exploits the strategies used by the AI. This way, Libratus could learn and fix these holes.
According to the follow up discussion, Libratus could probably defeat Deepstack, but they haven’t played against each other yet. The next challenges are applying these algorithms to solve similar issues in other domains, and making an AI that can actually be part of a table and join tournaments (this may imply a redefinition of the problem). Both researchers ended up stating how supportive the community has been providing feedback and useful ideas to improve their respective AIs.
The last keynote speaker was Russ Tedrake (MIT Robot labs), who presented advances in robotics and the lessons learned during the three year DARPA challenge on robotics. The challenge had a series of heterogeneous tasks (driving, opening a valve, cut a hole in a wall, open and traverse a door, etc.). Most of these problems are faced as optimization problems, and planning is a key feature that has to be updated on the go. Robustness is crucial for all the processes. For example, in the challenge, the MIT robot failed due to a human error and an arm broke off. However, thanks to the redundancy functions, the robot could finish the rest of the competition using only the other arm. As a side note, the speaker also explained why the robots always “walk funny”: their center of mass. It facilitates the equations for movement, so researchers have adopted it to avoid more complexity in their solutions.
One of the main challenges for these robots is perception. It has to run constantly to understand the surroundings of the robot (e.g., obstacles), dealing with possible noise data or incomplete information. The problem is that, when a new robot has to be trained, most of the data produced with other robots is not usable (different sensors, different means for grabbing and dealing with objects, etc.). Looking how babies react with their environment (touching everything and tasting it) might bring new insights in how to address these problems.
My highlights
-The “AI in practice” session that occurred on Sunday was great. The room was packed, and we saw presentations from companies like IBM, LinkedIn or Google.
I liked these talks because they highlighted some of the current challenges faced by AI. For example, Michael Witbrock (IBM) described how despite the advances in Machine Learning applications, the representations used to address a problem can barely be reused. The lack of explanation of deep learning techniques does not help either, specifically in diagnosing diseases: doctors want to know why a certain conclusion is reached. IBM is working towards improving the inference stack, so as to be able to combine symbolic systems with non-symbolic ones.
Another example was Gary Marcus (Uber labs), who explained that although there has been a lot of progress on AI, AGI (artificial general intelligence) has not advanced that much. Perception is more than being able to generalize from a situation, and machines are currently not very good at it. For example, an algorithm may be able to detect that there is a dog in a picture, and that the dog is lifting weights, but it won’t be able to tell you why this picture is unique or rare. The problem with current approaches is that they are incremental. Sometimes, there is a fear to step back and look at how some of our current problems are addressed. Focusing too much on incremental science (i.e., improving a small percentage of the precision of the current algorithms), may lead to get stuck in local maximums. Sometimes we need to address problems from different angles to make sure we make progress.
– AI in games is a thing! Over the years I have seen some approaches that aim to develop smart players, but attending this tutorial was one of the best experiences in the conference. Julian Toeglius gave an excellent overview/tutorial of the state of the art in the field, including how a simple A* algorithm may almost be a perfect player for Mario (if we omit those levels when we need to go back), how games are starting to adapt to players, how to build credible non player characters and how to create scenarios that are fun to play automatically. Then he introduced other problems that overlap with many of the challenges addressed in the keynotes: 1) How can we produce a general AI that learns how to play any game? And 2) how can we create a game automatically? For the first one, I found interesting that they have already developed a benchmark of simple games that will test your approach. The second one however is deeper, as the problem is not creating a game, or even a valid game. The real problem in my opinion is creating a game that a player considers fun. At the moment the current advances consist on modifications of existing games. I’ll be looking forward to reading more about this field and its future achievements.
– AI in education: Teaching ethics to researchers is becoming more and more necessary, given the pace at which science evolves. At the moment, this is an area often overlooked in any PhD or research program.
– The current NSF research plan is not mute! Lynne Parker introduced the creation of the AI research and development strategic plan, which expects to remain untouched even after the results of the latest election. The current focus is on how AI could help to the national priorities: liberty (e.g., security), life (education, medicine, law enforcement, personal services, etc.) and pursuit of happiness (manufacturing, logistics, agriculture, marketing, etc.). Knowledge discovery and transparent and explainable methods will help for this purpose.
– Games night! Great opportunity to socialize and meet part of the community by drawing, playing puzzles and board games.
– Many institutions are hiring. The Job fair had plenty of participating companies and institutions, but it was a little bit far away from the main events and I didn’t see many people attending. In any case, there were also plenty of companies with stands while the main conference was happening as well, which made it easy to talk to them and see what were they working on.
– Avoid reinventing the wheel! There was a cool panel on Expert systems history. Sometimes it is good to just take a step back and see how they analyzed research problems in the past. Some of their solutions still apply today
– Check out the program for more details on the talks and presentations.
Conclusions
Attending AAAI has been a great learning experience. I really recommend it to anyone working on any field of AI, especially if you are student or you are looking for a job. I also find very exciting that some of the problems I am working on are also identified as important by the rest of the community. In particular, the need of creating proper abstractions to facilitate understanding and shareability of current methods was part of the main topic of my thesis, while the need for explanation of the result of a certain technique is applied is highly related to what we do for capturing the provenance of scientific workflow results. As described by some of the speakers, “Debugging is a kind of alchemy” at the moment. Let’s turn it into a science.
As part of my work at the USC, I am always looking for different ways of helping scientist to reproduce their computational experiments. In order to facilitate software component deployment, I have been playing this week with Docker, a software wrapper that contains all the things you need to execute a software component.
The goal of this tutorial is to show you how you can get easily started to make your code reproducible. For more extensive tutorials and other Docker capabilities, I recommend you to go to the official Docker documentation: https://docs.docker.com/engine/getstarted/
Dockerizing your software: Docker images and containers
Docker handles two main concepts: containers and images. The images indicate how to set up and create an environment. The containers are the processes in charge of executing an image. For example, try installing Docker on your computer (https://docs.docker.com/engine/installation/) and test the “hello world” image:
docker run hello-world
If everything goes well, you should an image in your screen telling you that the Docker client contacted the Docker daemon, that the daemon pulled the “hello world” image from the Docker Hub repository, that then a new container was created, and that finally the output of the container was sent to your Docker client.
Docker has a local repository where it stores the images we create or pull from online repositories, such as the one we just retrieved. When we try to execute an image, Docker tries to find it locally and then online (e.g., on the Docker hub repository). If the system finds it, it will download it to our local repository. To browse over the images stored in your local repository, run the following command:
docker images
At the moment you should only see the “hello-world” image. Let’s try to do something fancier, like running an Ubuntu image with a unix command :
docker run ubuntu echo hello world
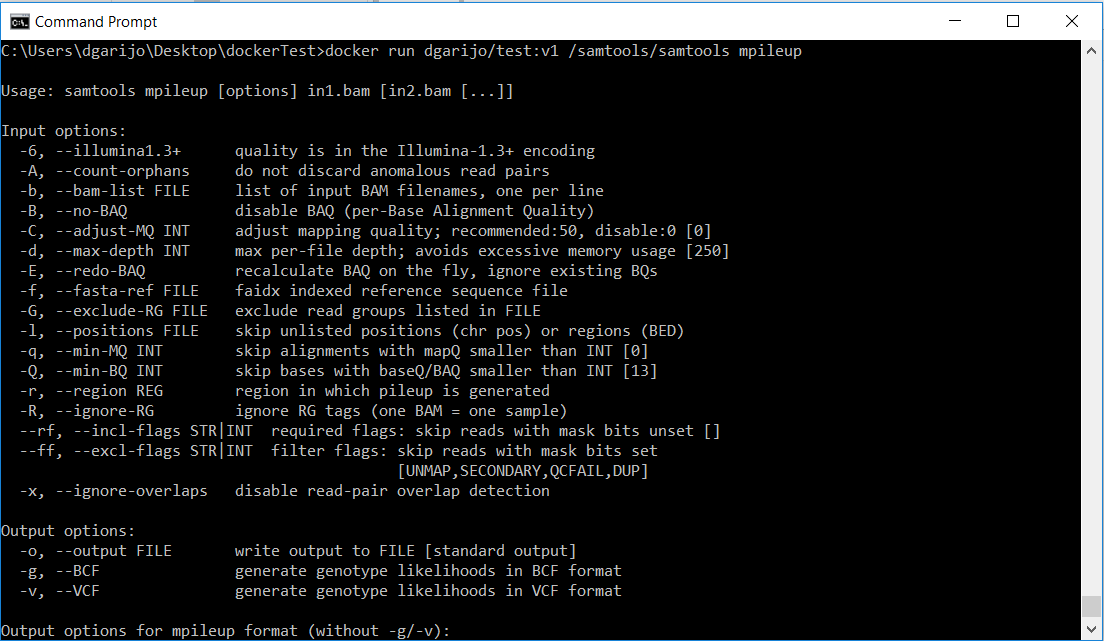
You should see “hello world” in the screen, after the image is downloaded. This is the same output you would obtain when executing that command in a terminal. If you are using popular software in your experiments, it is likely that someone has created an image and posted it online. For example, let’s consider that part of my experiment uses the samtools software, widely used in genomics analysis. In this example we will show how to reuse an image for samtools, the software we have used for the mpileup caller function.
will download the latest version. You can also specify the version by using a tag. For example comics/samtools:v1. Now if we execute the image locally:
docker run comics/samtools samtools mpileup
We will see the following on screen.
Basically, the program runs, but it is asking for its correct usage (we didn’t invoke it correctly). Since the mpileup software requires three inputs, in this tutorial we are going to choose a simpler function from the samtools software: sort, which sorts an input bam file.
In order to be able to pass the inputs file to our docker container, we need to mount a volume, i.e., tell the system that we want to share a folder with the container. This can be done with the “-v” option.
docker run -v PathToFolderYouWantToShare:/out comics/samtools samtools sort -o /out/sorted.bam /out/inputFileToSort.bam
Where the PathOfTheFolderYouWantToShare is the folder where you have your input file (“inputFileToSort.bam”). This will result in a sorted file (“sorted.bam”) of the input file “inputFileToSort” in the folder “PathToFolderYouWantToShare”.
All right, so now we have our component working. Now if we want anyone to use our inputs, we just have to tell them which Docker image to download. You may include your data also as part of the Docker image, but for that you will have to create your own Docker file (see below).
Creating Docker files
OK, so far it’s easy to reuse someone else’s software if there is an image online. But how do I create an image of the scripts/software I have done for others to reproduce? For this we need to create a Docker file, which will tell Docker how to build an image.
The first step is to build an image for the software we want to install. In my case, I chose the Ubuntu default image, and then added the steps and dependencies of the samtools software. My Docker file looks as it follows:
from ubuntu
MAINTAINER add yourself here emailgoeshere@example.com
RUN apt-get update && apt-get install -y python unzip gcc make bzip2 zlib1g-dev ncurses-dev
COPY samtools-1.3.1.tar.bz2 samtools.tar.bz2
RUN bunzip2 samtools.tar.bz2 && tar xf samtools.tar && mv samtools-1.3.1 samtools && cd samtools && make
ENV PATH /samtools:$PATH
The image created by this Docker file modifies the Ubuntu image we downloaded before, installing python, unzip, gcc, make, bzip2, zlib-dev and ncurses-dev, which are packages used by samtools. Thanks to this, we will have access to those commands from our Linux terminal in our container. The second command copies the software we want to install into the container (download it from https://sourceforge.net/projects/samtools/files/samtools/), unzips it and compiles it, adding “/samtools” to the system path. Note that if we want to copy sample data to the image, this would be another way to do so.
Now we just have to build the file using the following Docker command:
youruser/nameOfImage is just a way to tag the images you create. In my case I named it dgarijo/test:v1. Later, when running the image as a container, we will use this name. The -f option points to the docker file you want to build as an image. This flag is optional: if you don’t include it, it will search on your local folder. Also, in some cases there are known issues. If you run into any trouble, just use:
docker build -t dgarijo/test:v1 DIRECTORY .
Where the “DIRECTORY” contains a docker file called “Dockerfile”.
Now that our image is in our local repository, let’s run it using the –v option to pass the appropriate inputs:
docker run -v PathOfTheFolderWithTheBamFile:/out nameOfYourImage samtools/samtools sort -o /out/sorted.bam /out/canary_test.bam
After a few seconds, you should see that the program ends, and a new file “sorted.bam” has appeared in your shared file. Now that your image works, you should consider uploading to the Docker hub repository (see the tutorial on the Docker site)
I have recently realized that I haven’t published any post for a while, so I don’t think there is a better way to start 2017 than with a small tutorial: how to mint w3ids for your ontologies without having to issue pull requests on Github.
In a previous post I described how to publish vocabularies and ontologies in a permanent manner using w3ids. These ids are community maintained and are a very flexible approach, but I have found out that doing pull requests to the w3id repository may be a hurdle for many people. Hence, I have been thinking and working towards lowering this barrier.
Together with some colleagues from the Universidad Politecnica de Madrid, we released a year and a half ago a tool for helping documenting and evaluating ontologies: OnToology. Given a Github repository, OnToology tracks all your updates and issues pull requests with their documentation, diagrams and evaluation. You can see a step by step tutorial to set up and try OnToology with the ontologies of your choice. The rest of the tutorial assumes that your ontology is tracked by OnToology.
So, how can you mint w3ids from OnToology? Simple, go to “my repositories tab:
Then expand your repository:
And select “publish” on the ontology you want to mint a w3id:
Now OnToology will request a name for your URI, and that’s it! The ontology will be published under the w3id that appears below the ontology you selected. In my case I selected to publish the wgs84 ontology under the “wgstest” name:
As shown in the figure, the ontology will be published under “https://w3id.org/def/wgstest”
If you want to update the html in Github and want to see the changes updated, you should click on the “republish” button that now replaces the old “publish” one:
Right now the ontologies are published on the OnToology server, but we will enable the publication in Github by using Github pages soon. If you want the w3id to point somewhere else, you can either contact us at ontoology@delicias.dia.fi.upm.es, or you can issue a pull request to w3id adding your redirection before the 302 redirection in our “def” namespace: https://github.com/perma-id/w3id.org/blob/master/def/.htaccess
Some time ago, I wrote a small post to guide people on how to easily develop the documentation of your ontology when publishing it on the Web. The ontology documentation is critical for reuse, as it provides an overview of the terms of the ontology with examples, diagrams and their definitions. Many researchers describe their ontologies in associated publications, but in my opinion a good documentation is what any potential reuser will browse if they want to include the ontology on their work.
As I pointed out in my previous post, there are several tools to produce a proper documentation, like LODE and Parrot. However, these tools focus just in the concepts of the ontology, and when using them I found myself facing three main limitations:
That the tools are in web services external to my control, and whenever the ontology is larger than a certain size, the web service will not admit it.
That whenever I want to export the produced ontology documentation, it’s not straightforward: I have to download a huge html and it dependencies from the browser.
That if I want to edit the ontology documentation adding an introduction, diagrams, etc., I have to edit the huge downloaded html. This is cumbersome, as finding the spot where I want to add new contributions is difficult. Normally the edition of the text is mandatory, as some of the metadata of the ontology is not annotated within the ontology itself.
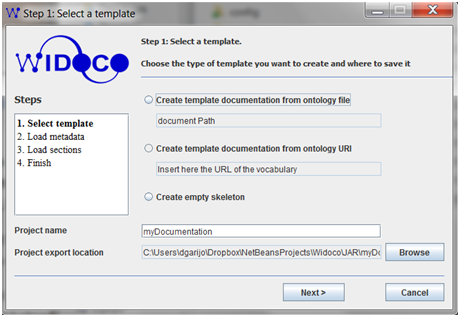
In order to face these limitations, I decided to create Widoco, a WIzard for DOCumenting Ontologies, more than a year ago. Widoco is based on LODE and helps you creating the ontology in three simple steps: introducing the ontology URI or file, completing its metadata and selecting the structure of the document you want to build. You can see a snapshot of the wizard below:
Widoco screenshot
Originally, Widoco produced the documentation offline (no need to use external web services and without a limit for the size of your ontology) and the output was divided in different documents, each of them containing a new section. That way, it was more manageable to edit each of them. The idea here is to be similar to Latex projects, where you include the sections you desire on the main document and comment those you don’t want to include. Ideally, the document would readapt itself to show only the sections you want, dynamically.
After some work, I have just released the version 1.2.2 of the tool, and I would like to comment some of its features here.
Metadata gathering improvements: Widoco will aim to extract metadata from the ontology itself, but that metadata is often incomplete. With Widoco now it is possible to introduce many metadata fields on the fly, if the user wants them to be added to the documentation. Some of the latest added metadata fields indicate the status of the document and how to properly cite the ontology, including its DOI. In addition, it is possible to save and load the metadata properties as a .properties file, in case the documentation needs to be regenerated in the future. As for the license, if an internet connection is available, Widoco will aim to retrieve the license name and metadata from the Licensius web services, where an endpoint of licenses is ready for exploitation.
Widoco configuration screenshot
Access to a particular ontology term: I have changed the anchors in the document to match the URI of the terms. Therefore, if a user derreferences a particular ontology term, he/she will be redirected to the particular definition of that term in the document. This is useful because it saves time when looking for the definition of a particular concept.
Automatic evaluation: If an internet connection is available, Widoco uses the OOPS! web service to detect common pitfalls in your ontology design. The report can be published along with the documentation.
Towards facilitating ontology publication and content negotiation: Widoco now produces a publishing bundle that you can copy and paste in your server. This bundle is published according to the W3C best practices, and adapts depending on whether your vocabulary is hash or slash.
Multiple serialization: Widoco creates multiple serializations of your ontology and points to them from the ontology document. This helps any user to download their favorite serialization to work with.
Provenance and page markup: The main metadata of the ontology is annotated using RDF-a, so the web searchers like Google can understand and point to the contents of the ontology easily. In addition, an html page is created with the main provenance statements of the ontology, described using the W3C PROV standard.
Multilingual publishing: Ontologies may be described in multiple languages, and I have enabled Widoco to generate the documentation in a multilingual way, linking to other languages on each page. That way you avoid having to run the program several times for generating the documentation in different languages.
Multiple styles for your documentation: now I have enabled two different styles for publishing the vocabularies, although I am planning to adapt the new respec style from the W3C.
Dynamic sections: For each section added in the document, the user will not have to worry about their numbering, as it will be done automatically. In addition, the table of contents will change accordingly to the sections the user wants to include in the final document.
Due to the amount of requests, I also created a console version of Widoco, with plenty of options to be able to run all the possible combinations of the features listed above. Even though you don’t need internet connection, you may want it for accessing Licensius and OOPS! webservices. Both the console version and desktop application are available through the same JAR, accessible in the Github: https://github.com/dgarijo/Widoco/releases/tag/v1.2.2
I built this tool to make my life easier, but it turns out that it can be used to make the life of other people easier too. Do you want to use Widoco? Check out the latest release on Github. If you have any problems open an issue! Some new features (like an automated changelog) will be included in the next releases.
The last week of January I was invited to a Dagstuhl seminar about reproducibility in e-Science, and I think it would be helpful to summarize and highlight some of the results in this blog post. A more detailed report will be published in the next few months; so take this as a sneak peek. If you want to reference any of the figures or tables in the summary, please cite the Dagstuhl report.
So… what are Dagstuhl seminars?
They consist on one week meetings that group together researchers of a community to discuss about a certain topic. The seminars are held in the Dagstuhl school of informatics, near Wadern, a location far from any big city. Basically, the purpose of these seminars is to isolate the participants from the world in order to push forward discussions about the topic at hand.
The seminar was organized by Andreas Rauber, Norbert Fuhr and Juliana Freire, and I think they did a great job bringing people from different areas: Information retrieval, psychology, bioinformatics, etc. It would have been great to see more people from libraries (who have been in charge of preserving knowledge for centuries) and editorials and funding agencies, as in my opinion they are the ones who can really push forward reproducibility by making authors comply with reproducibility guidelines/manifestos. Maybe we can use the outcomes of this seminar to convince them to join us the next time.
To be honest, I was a bit afraid that this effort would result in just another manifesto or set of guidelines for enabling reproducibility. Some of the attendants in the seminar shared the same feeling, and therefore one of the first items of the agenda resulted in summaries of other reproducibility workshops that other participants had attended to, like the Euro RV3 workshop or the Artifact Evaluation for Publication workshop (also held at Dagstuhl!). This helped shape a little bit the agenda and move forward.
Tools, state of the art and war stories:
Discussion is the main purpose of the Dagstuhl seminar, but the organizers scheduled a couple of sessions for each participant to introduce what they had been doing to promote reproducibility. This included specific tools for enabling reproducibility (e.g., noWorkflow, ReproZip, yesWorkflow, ROHub, etc.), updates on the state of the art of a particular area (e.g., the work done by the Research Data Alliance, music, earth sciences, bioinformatics, visualization, etc.) and war stories of participants that had attempted reproducing other people’s work. In general, the presentations I enjoyed the most were the war stories. At the beginning of my PhD I had to reproduce an experiment from a paper, and it may involve some frustration and a lot of work. I was amazed by the work done by Martin Potthast (see paper) and Christian Coldberg (see paper) to actually empirically reproduce the work by others. In particular, Christian maintains a list of the papers he and his group have been able to reproduce. Check it out here.
Measuring the information gain
What do we gain by making an experiment reproducible? In an attempt to address this question, we identified the main elements in which a scientific experiment can be decomposed. Then, we analyzed what would happen if each of these components changed, and how each of these changes relates to reproducibility.
The atomic elements of an experiment are the goals of the experiment, the abstract methods (algorithms, steps) used to achieve the goals, the particular method used to implement the abstract algorithm or sketch, the execution environment or infrastructure used to execute the experiment, the input data and parameter values and the scientists involved in the experiment execution. An example is given below:
(R) Research Objectives / Goals: Reorder stars by their size.
(M) Methods / Algorithms: Quicksort.
(I) Implementation / Code / Source-Code: Quicksort in Java .
(D) Data (input data and parameter values): The dataset X from the Virtual observatory catalog
(A) Actors / Persons: Daniel, who design executes the experiment.
The preservation of each these elements of the experiment may change the obtained results. For example, if we change the input data but keep the rest of the parts the same, we ensure the robustness of the experiment (new data may identify new corner cases that were not considered before). If we change the platform successfully but preserve the rest, then we improve the portability of the experiment. In the following table you can see a summary of the overall discussion. Due to time constraints we didn’t alter all the possible columns to represent all possible scenarios, but we represented the ones that are more likely to happen:
There are three main types of actions that you can take in order to improve the reproducibility of your work. These are proactive actions (e.g., data sharing, workflow sharing, metadata documentation, etc.), reactive actions (e.g., a systematic peer review of the components of your experiment, reimplementation studies, etc.) and supportive actions (e.g., corpus construction for reproducibility, libraries of tools that help reproducibility, etc.). These actions affect three different categories: those which involve paper reproducibility (i.e., individual papers), those which involve improving the reproducibility of groups of papers affecting a particular area of interest (like health studies that recommend a solution for a particular problem) and those which involve the creation of benchmarks that ensure that a proposed method can be executed with other state of the art data.
The following figure (extracted from the report draft) summarizes the taxonomy discussion:
A taxonomy for reproducibility
Actors in reproducibility and guidelines for achieving reproducibility.
Another of the activities I think it’s worth mentioning on this summary is the analysis part of the group did about the different types of authors that participate in one way or the other in reproducibility, along with the obstacles these actors may find in their path.
There are 6 types of actors in reproducibility: those that create contents (authors, lab directors, research software engineers, etc), those that consume the contents (readers, users, authors, students, etc.), those that moderate the contents (editors), those who examine the contents (reviewers, examiners, etc.), those who enable the creation of the contents (funders, lab directors, etc.) and those who audit the contents (policy makers, funders).
For each of the actors, the group discussed checklists that guided them on how to fully achieve the reproducibility of their contents in three different levels: sufficient (i.e., minimum expectation of the actor regarding the demands for reproducibility), better (an additional set of demands which improve the previous ones) and exemplary (i.e., best practices). An example of these checklists for authors can be seen below (extracted from the report):
Sufficient:
Methods section – to a level that allows imitation of the work
Appropriate comparison to appropriate benchmark
Data accurately described
Can re-run the experiment
Verify on demand (provide evidence that the work was done as described)
Ethical considerations noted, clearances listed
Conflicts noted, contributions and responsibilities noted
Use of other authors’ reproducibility materials should respect the original work and reflect an attempt to get best-possible results from those materials
Better:
Black/white box
Code is made available, in the form used for the experiments
Accessible or providable data
Exemplary:
Open-source software
Engineered for re-use
Accessible data
Published in trustworthy, enduring repository
Data recipes, to allow construction of similar data
Data properly annotated and curated
Executable version of the paper; one-click installation and execution
Making a reproducibility paper publishable
Another cool effort aimed to determine whether reproducibility is a means or an end for a publication. Hence, the group discussed if an effort to reproduce an actual research paper would be publishable or not depending on the available resources and the obtained outcome. Generally, when someone intends to reproduce existing work is because they want to repurpose it or reuse it in their experiments. But that objective may be affected, for example, if the code that implemented the method aimed to be reproduced is no longer available. The discussion led to the following diagram, which discusses a set of possible scenarios:
Can reproducibility help you to publish a paper?
In the figure, the red crosses indicate that the effort would not have much value as a new publication. The pluses indicate the opposite, and the number of pluses would affect the target of the publication (one plus would be a workshop, while four pluses would be a top journal/conference publication). I find the diagram particularly interesting, as it introduces another benefit for trying to make reproduce someone else’s experiments.
Incentives and barriers, or investments and returns?
The incentives are often the main reason why people adopt best practices and guidelines. The problem is that, in the case of reproducibility, each incentive has also an associated cost (e.g., making all the resources available in an open license). If the cost is excessive for its return, then some people might just not consider it worth it.
One of the discussion groups aimed to address this question by categorizing the costs/investments (e.g. artifact preparation, documentation, infrastructure, training, etc.) and returns/benefits (publicity, knowledge transfer, personal satisfaction, etc.) for the different actors identified above (funders, authors, reviewers, etc.). The tables are perhaps too big to include them here (you can have a look once we publish the final report), but in my opinion the important message to take home is that we have to be aware of the cost of reproducibility and its advantages. I have personally experienced how frustrating is to document in detail the inputs, methods and outputs used on a Research Object that expands on a paper that has already been accepted. But then, I have also seen the benefits of my efforts when I wanted to rerun the evaluations several months later, after I had done additional improvements.
Defining a Research Agenda: Current challenges in reproducibility
Do you want to start a research topic about reproducibility? Here are a few challenges that may help you to get ideas to contribute to the state of the art!:
What are the interventions needed to change of behavior of the researchers?
Do reproducibility and replicability translate in long term impact for your work?
How do we set the research environment for enabling reproducibility?
Can we measure the cost of reproducibility/repeatability/documentation? What are the difficulties for newcomers?
Final thoughts:
In conclusion, I think the seminar was a positive experience. I learnt, met new people and discussed about a topic that is very close to my research area with experts on the field. I think there could be a couple of things that could be improved, like having a better synchronization with other reproducibility efforts taking place in Dagstuhl or having more representation from the publisher and funding agencies side, but I think the organizers will take it into account for future meetings.
Special thanks to Andy, Norbert and Juliana for making the seminar happen. I hope everyone enjoyed as much as I did. If you want to know more about the seminar and some of its outcomes, have a look at the report!